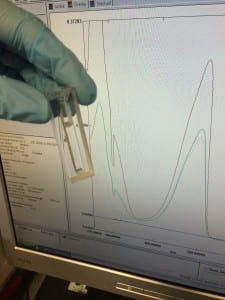
This procedure took me over to the Science building here at the University of Lincoln, away from my usual stomping ground of Joseph Banks Laboratories. I made my way up to the analytical chemistry lab to use the UV-Vis spectrophotometer. For all you lay persons, this is a machine that uses light (in this case, ultraviolet and visible light) to determine the quantity of a particular substance in a sample by exciting the substance with light and recording what is absorbed and at what frequency (wavelength). This will be specific to a particular substance.
In my case, I am looking for light absorbed at a frequency of 482nm (the known absorption wavelength of eGFP – the variant of GFP that I am using). Take a look:
The different spectra (lines) that you can see, are separate samples that I had run through the machine. I did this by loading my samples into the specially designed cuvette that you can also see in the picture, loaded it into the machine before running the appropriate blank and let the machine do it’s thing.
Once I had collected the data from my samples, the hundreds of values obtained were loaded into excel, plotted on a graph and analysed using the beer-lambert law:
![]()
Where: A is the absorbance value, ε is the molar absorptivity (a constant value for the substance), l is the path length of light through the sample, and c is the concentration (what I am trying to find).
Post-evaluation, I concluded that this batch contained a good yield of my target protein. Good job, self.
