SDS-PAGE (Confirmation of His-GFP-NT Purity)

There is very little need for much text in this post. This picture says it all. The column on the far right shows my crude mix of protein before purification, the far left is the protein ladder (for reference), and the big blobs that you can see in between are samples of my purified protein. It’s quite a difference. This is how I qualitatively show the purity of my newly purified samples.

IMG_1967

This technique was carried out on the same day as quantification of the samples to avoid excessive freeze-thaw cycles.

His-GFP-NT Quantification

This procedure took me over to the Science building here at the University of Lincoln, away from my usual stomping ground of Joseph Banks Laboratories. I made my way up to the analytical chemistry lab to use the UV-Vis spectrophotometer. For all you lay persons, this is a machine that uses light (in this case, ultraviolet and visible light) to determine the quantity of a particular substance in a sample by exciting the substance with light and recording what is absorbed and at what frequency (wavelength). This will be specific to a particular substance.

In my case, I am looking for light absorbed at a frequency of 482nm (the known absorption wavelength of eGFP – the variant of GFP that I am using). Take a look:

                                                                     IMG_1971


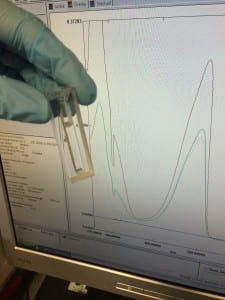
The different spectra (lines) that you can see, are separate samples that I had run through the machine. I did this by loading my samples into the specially designed cuvette that you can also see in the picture, loaded it into the machine before running the appropriate blank and let the machine do it’s thing.

Once I had collected the data from my samples, the hundreds of values obtained were loaded into excel, plotted on a graph and analysed using the beer-lambert law:

Where: A is the absorbance value, ε is the molar absorptivity (a constant value for the substance), l is the path length of light through the sample, and c is the concentration (what I am trying to find).

Post-evaluation, I concluded that this batch contained a good yield of my target protein. Good job, self.

DNA Extraction

Cast your minds back to my post concerning bacterial transformation (or just scroll down, whatever). One thing that I forgot to mention was how I extracted pAG4 from the XL-1 blue bacterial cells once it had been replicated. That’s where this post comes in.

Minipreps were performed on four separate 5ml overnight cultures of pAG4 containing XL-1 blues in LB broth. This procedure requires a number of different reagent additions to ultimately extract pure pAG4 from the cells without damaging the plasmid itself. To do this, the cells need to be separated from the culture medium by means of centrifugation, lysed, and cellular debris needs to be centrifuged out of suspension. Leaving only cellular content, including the plasmid.

The processed samples are then run through Qiagen miniprep tubes. Miniprep tubes contain a filter with an affinity for DNA, which allows for all non-target cellular contents to pass through the tube with the aid of wash buffers. The ‘caught’ DNA is then flushed through the tube and collected. Simple.

IMG_1809

The 5ml culture, reagents and miniprep tubes can be seen in the above image.

Protein Purification

Following snap-freeze cycles from the last protocol, this next one focuses on the purification of my protein sample. I did this using immobilised metal ion affinity chromatography – as previously stated, the protein contains a His-tag, hence the means of its purification. A 1ml HiTrap purification column was used.

This protocol consisted of a number of steps:

  1. Wash of the column with ultra pure water
  2. Equilibration of the column using the same protein buffer that the protein sample was resuspended in
  3. Addition of protein sample in protein buffer
  4. Elution of the column with low concentration imidazole buffer
  5. Elution of the column with high concentration imidazole buffer
  6. Wash of the column with ultra pure water and 20% ethanol

IMG_1945 IMG_1949 IMG_1950

The first image above shows the column after the addition of the protein sample (again, green because it contains GFP). Notice how it forms a noticeably green band at the top of the tube, this is the region in which the protein is most highly concentrated. The second image shows the column after the first elution with low concentration imidazole buffer. For reference, imidazole is employed to elute the column because it competitively binds to the same site that Histidine attaches to. This enables the protein to move down the column once it has detached and not re-attach. The third image shows the product of elution with high concentration imidazole – 10 column volumes were run through the column and collected in separate 1 column volume aliquots, labelled here as 1-10). You can clearly see that the highest concentration was eluted in the second column volume of buffer.

Next week: SDS-PAGE to analyse the raw sample vs my newly purified sample.

Liquid Nitrogen – Cool (Did I Mention That I Love Puns?)

The 200ml cultures from the last protocol were aliquoted into 8, 50ml centrifuge tubes and spun down at 3000g to separate the cells containing my protein of interest from the media in which they were cultured- the pellet consisted of a layer of bright green (my protein) and a layer of light brown (cellular debris). The supernatant was then removed and the pellet frozen down in a -80*c freezer. Later, the pellet was resuspended in pH and salt specific Tris protein buffer with added DNAase.

This marks the part of the protocol that requires protein extraction from the cells by lysis – the method of choice was several freeze-thaw cycles in liquid nitrogen (6 to be exact). Multiple drastic change in temperature within a short space of time causes a reducing in cellular integrity and cause the cells to lyse, releasing their contents including my protein of interest: His-GFP-NT. At this stage, the sample was spun down at 3000g to pellet out cellular debris.

    IMG_1923 IMG_1937 IMG_1944

The first two photos above show the sample during each stage of the freeze-thaw cycles. The latter shows the cellular debris pellet after centrifugation, the green supernatant contains my target protein.

The supernatant was filtered and frozen down, ready for the next part of the protocol – protein purification.